Sometimes our perceptions of risk align with actual risk and sometimes they don’t. How about bicycling? How risky does it seem to you compared to other sports or compared to other modes of travel?
Before you answer, we should give you a definition of “risk” as defined by epidemiologists. It needs a numerator: the number of injuries. But it also needs a denominator: how many people, how often, or how far? In other words, we need to “adjust” for exposure.
What is the relative safety of sports?
Researchers from Quebec studied the number of injuries per 1000 participants for many sports. Five are reported in the graph on the left, in order from lowest risk to highest.
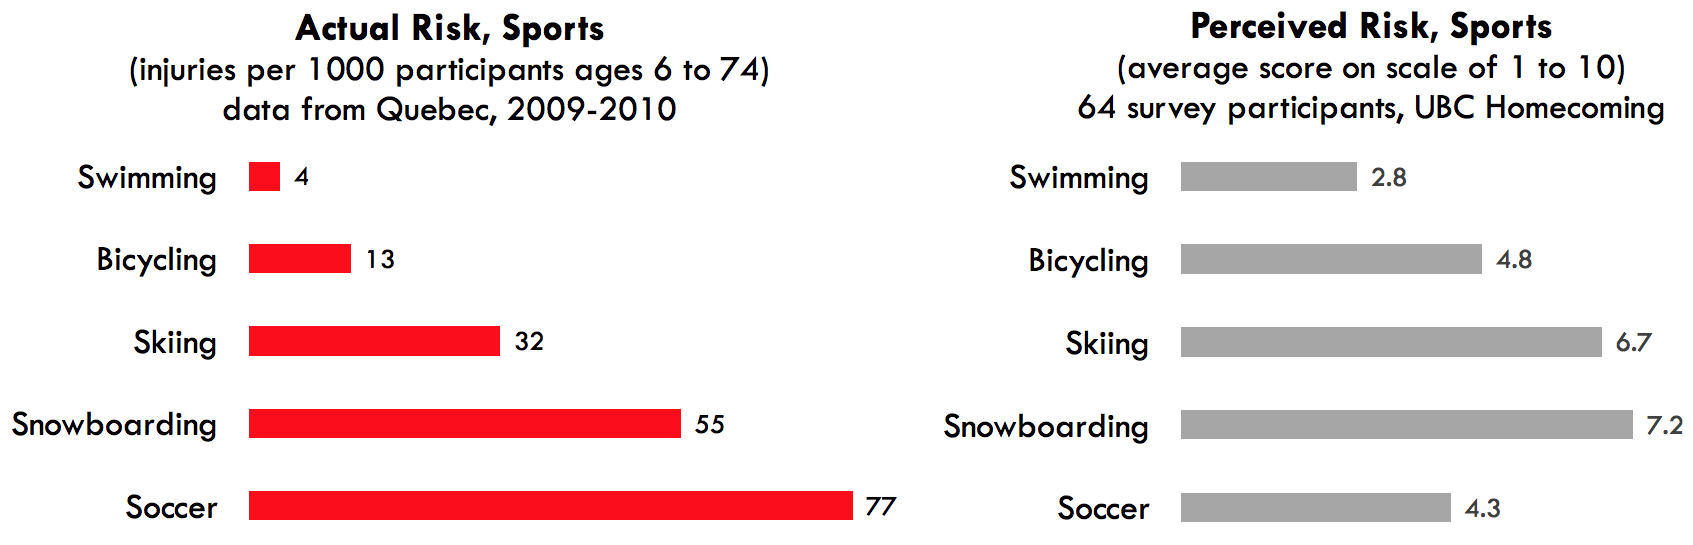
We asked participants in UBC’s 2017 Homecoming to indicate how they perceived the risk of the same 5 sports on a scale from 1 to 10. The average scores are reported in the graph on the right. In general, people’s perceived risk ranking was very similar to the actual risk ranking of the 5 sports, with the exception of soccer. Soccer had the highest actual injury risk, but was perceived to be safer than most of the other sports.
What is the relative safety of travel modes?
Researchers from the US studied the number of deaths per 100 million trips for various travel modes. We repeated the study in British Columbia for bicycling, walking, and driving only, because there wasn’t appropriate data on transit and motorcycling. Where we did have data, the results in BC were nearly identical to the US, so in the graph on the left we report BC data where available, and US data for transit and motorcycling. The travel modes are reported in order from lowest risk to highest. Note that the risk for motorcycling was so high, it didn’t fit on the scale, but we reported the risk level with arrows showing it should have a much longer bar.
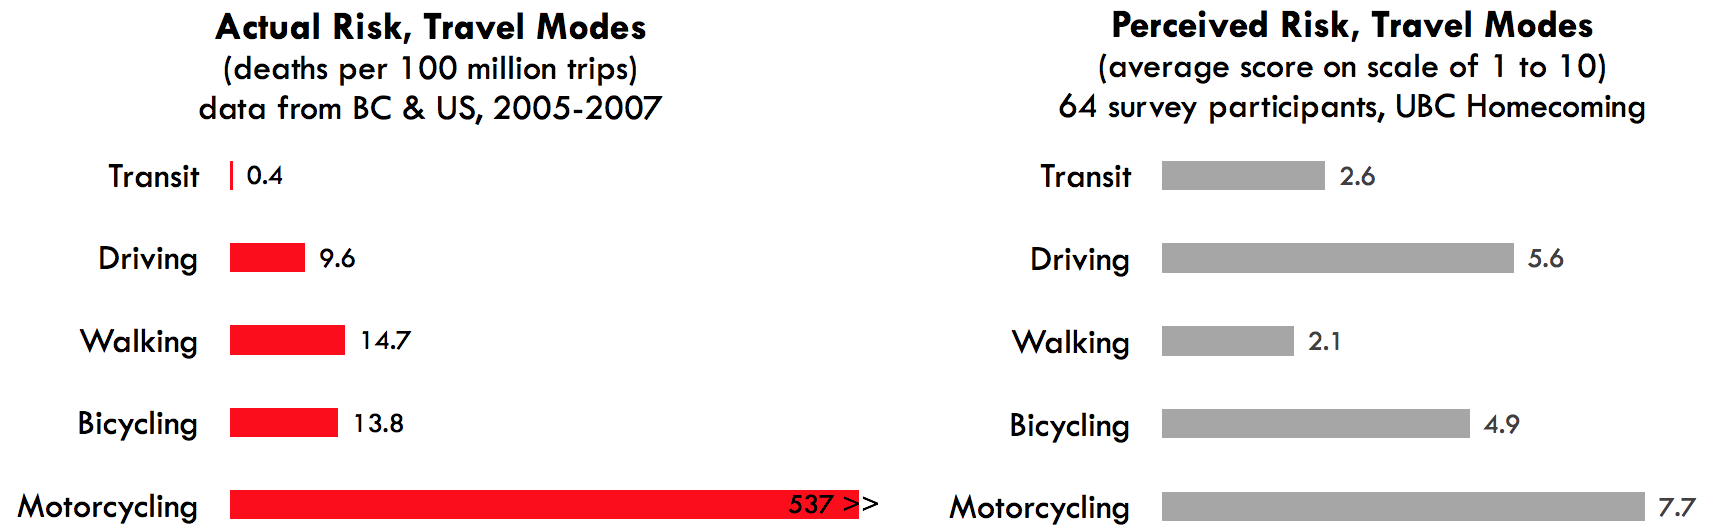
We asked participants in UBC’s 2017 Homecoming to indicate how they perceived the risk of the same 5 travel modes on a scale from 1 to 10. The average scores are reported in the graph on the right. People correctly perceived that motorcycling is the riskiest mode of travel, but did not realize that transit is the safest, by far. They also thought walking was the safest mode, but it has similar risk to driving and bicycling.
Note that although driving is slightly safer than walking and bicycling when it comes to injuries, driving is sedentary. Walking and cycling both provide physical activity and are much healthier than driving overall. If you want to know more about the benefits vs. risks of cycling, see the article linked at the upper left of this page.
More information about the safety of various travel modes is available on this page of our website.