The study
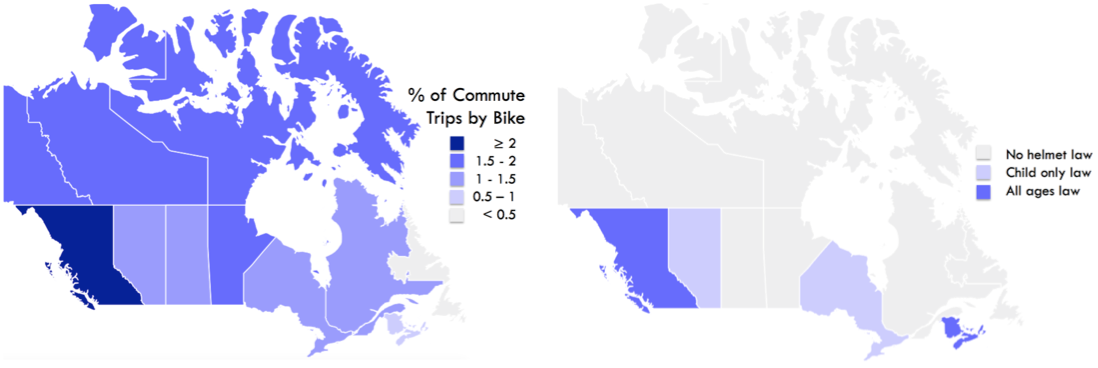
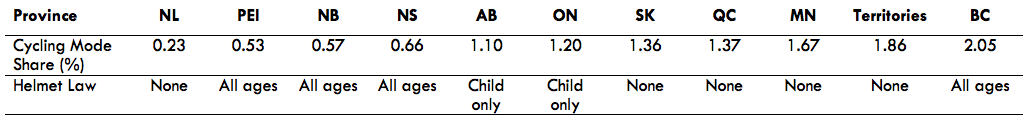
In Canada, cycling conditions and laws differ across provincial jurisdictions, providing an opportunity for comparisons of injury risk. Some provinces have a higher percent of trips by bike (mode share) than others. Some provinces have helmet laws (for children only or for all age groups) and others have none. The following maps and table show these differences as they were in the period from 2006 through 2011.
We compared “exposure-based” cycling injury hospitalization rates across Canadian provinces to see if there were associations with the following characteristics:
- percent of trips by bike (mode share)
- helmet laws
- age group (youth from 12 to 17 years old, adults 18+)
- sex
The study period was 2006 to 2011 when mode shares and helmet laws were stable. Data on hospitalizations were from the Canadian Institute for Health Information. Data on bicycling trips were from the Canadian Community Health Survey.
Cycling hospitalizations, trips, rates
There was an average of 3690 hospitalizations/year for cycling injuries among youths and adults across Canada. Half the injuries had traffic-related causes (occurred on public roads).
The body regions injured are shown below. The subgroup totals add to more than the group totals and more than 100% overall because some people had injuries to multiple body regions.
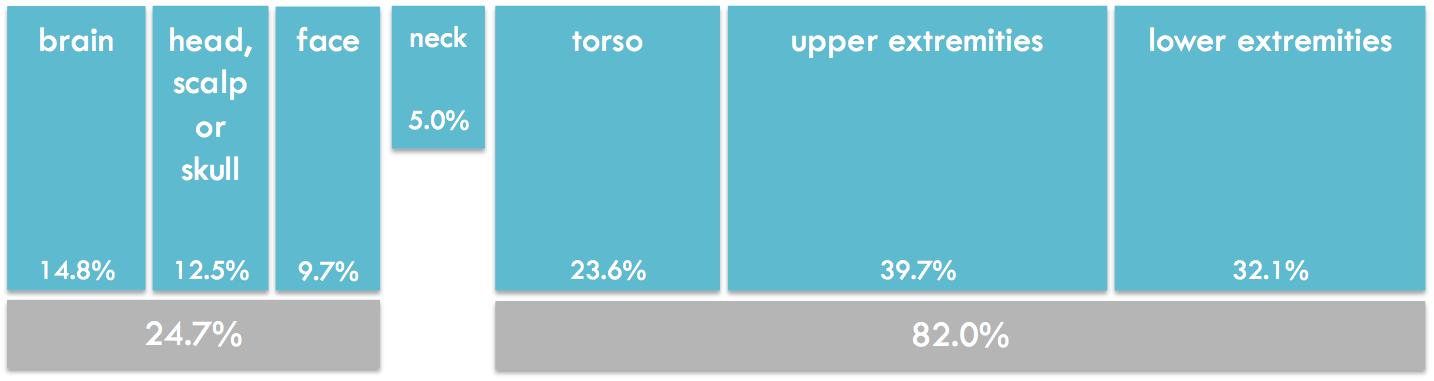
There were an estimated 593 million cycling trips per year. The nationwide hospitalization rate was 633 per 100 million trips (or, put another way, 1 hospitalization per 158,000 trips). For head injuries only, the nationwide hospitalization rate was per 156 per 100 million trips (or 1 head injury hospitalization per 640,000 trips).
Percent of trips by bike (cycling mode share)
Hospitalization rates for traffic-related injuries were lower with a higher percent of trips by bike (mode share, graph below), a phenomenon observed in other studies. It is often called “safety in numbers”, though the explanation could also be “numbers in safety” as safer bike routes have been shown to attract more people to cycle. The graph shows hospitalization rates for injuries to any body region, by mode share. There are 22 rates – youths and adults separately for 11 jurisdictions (10 provinces and the three northern territories together in one group).
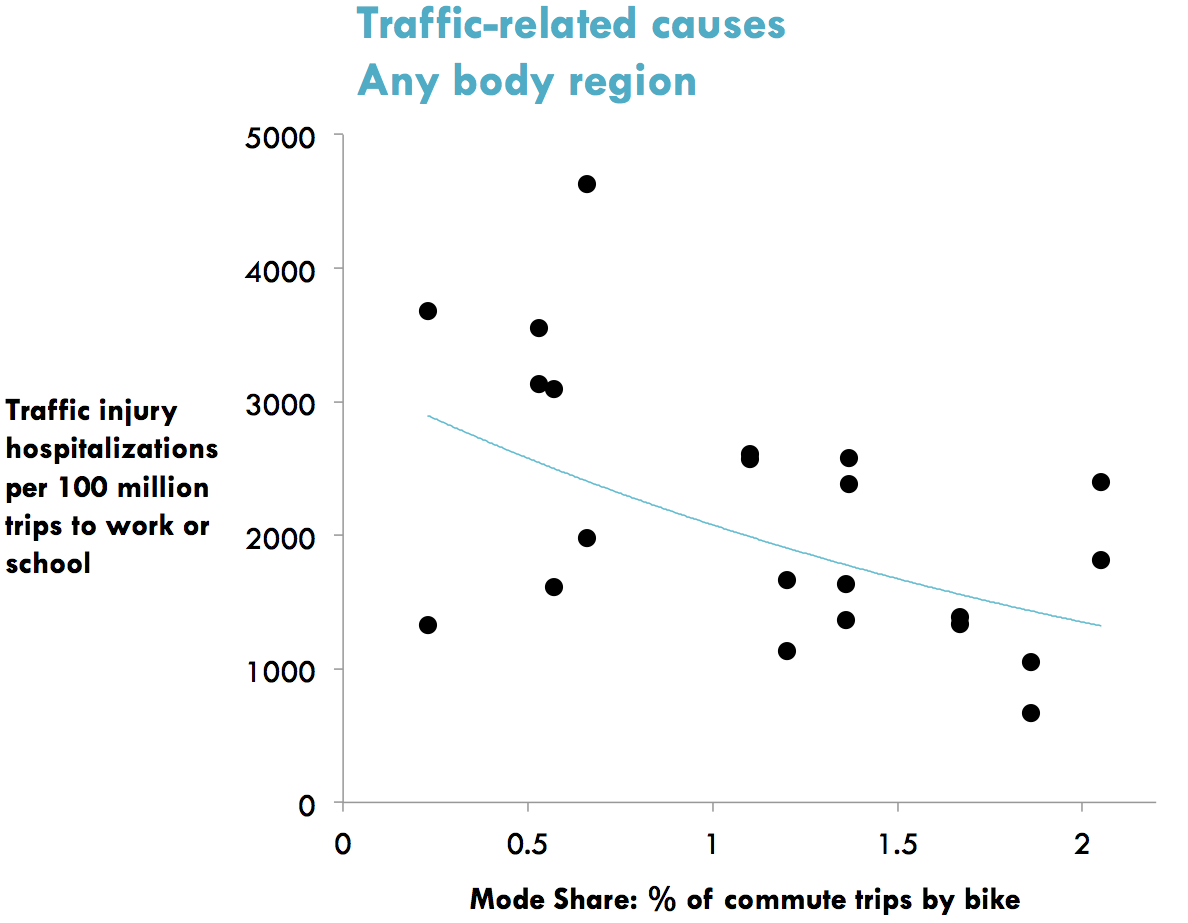
Note that the graph shows traffic-related causes – injuries on public roads. We did not observe the same trend for all causes (injuries on & off road, see graphs below). Off-road mountain biking is very popular in some provinces and may have influenced all cause injury rates. Injuries in this sport would not be expected to be related to cycling transportation mode share.
Helmet laws
There was no relationship between helmet laws and hospitalization rates for injuries to the brain, head, scalp, skull or face. This was true for all causes (graph below) and for traffic-related causes (graph in academic paper – link below). The graph shows hospitalization rates, indicating whether a helmet law applied or not. There are 44 rates – male & female youths and male & female adults, separately for 11 jurisdictions (10 provinces and the three northern territories together in one group).
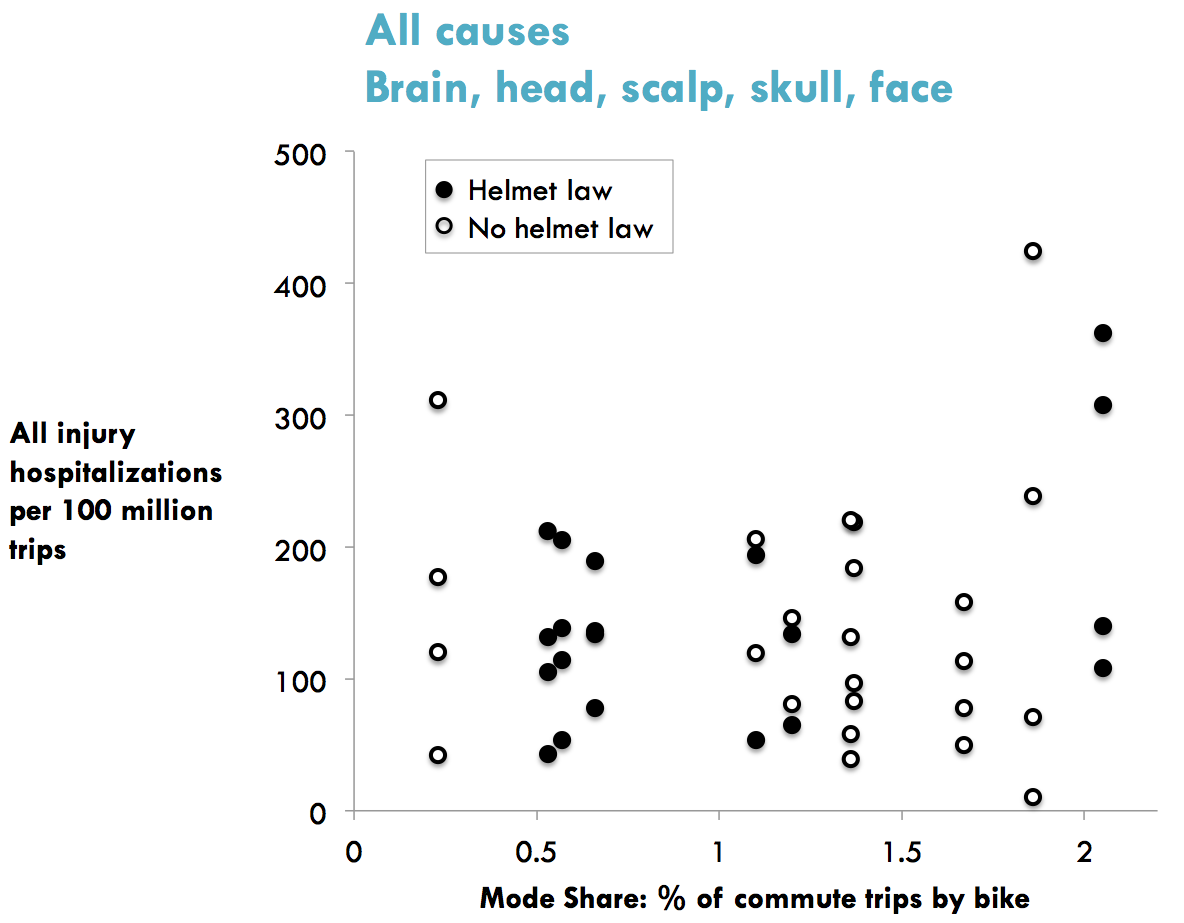
Note that provinces can be identified by their mode share, listed in the table at the top of the page.
Sex and age group
Females had consistently lower hospitalization rates than males, an effect observed in other transport modes. This is thought to be related to a lower propensity for risk taking, for example, women have been found to cycle more slowly and to be less likely than men to ride on major streets without bike facilities, routes that have been shown to have higher injury risk. The graph below shows hospitalization rates, indicating whether the rate was for males or females. It shows 44 rates – male & female youths and male & female adults, separately for 11 jurisdictions (10 provinces and the three northern territories together in one group).
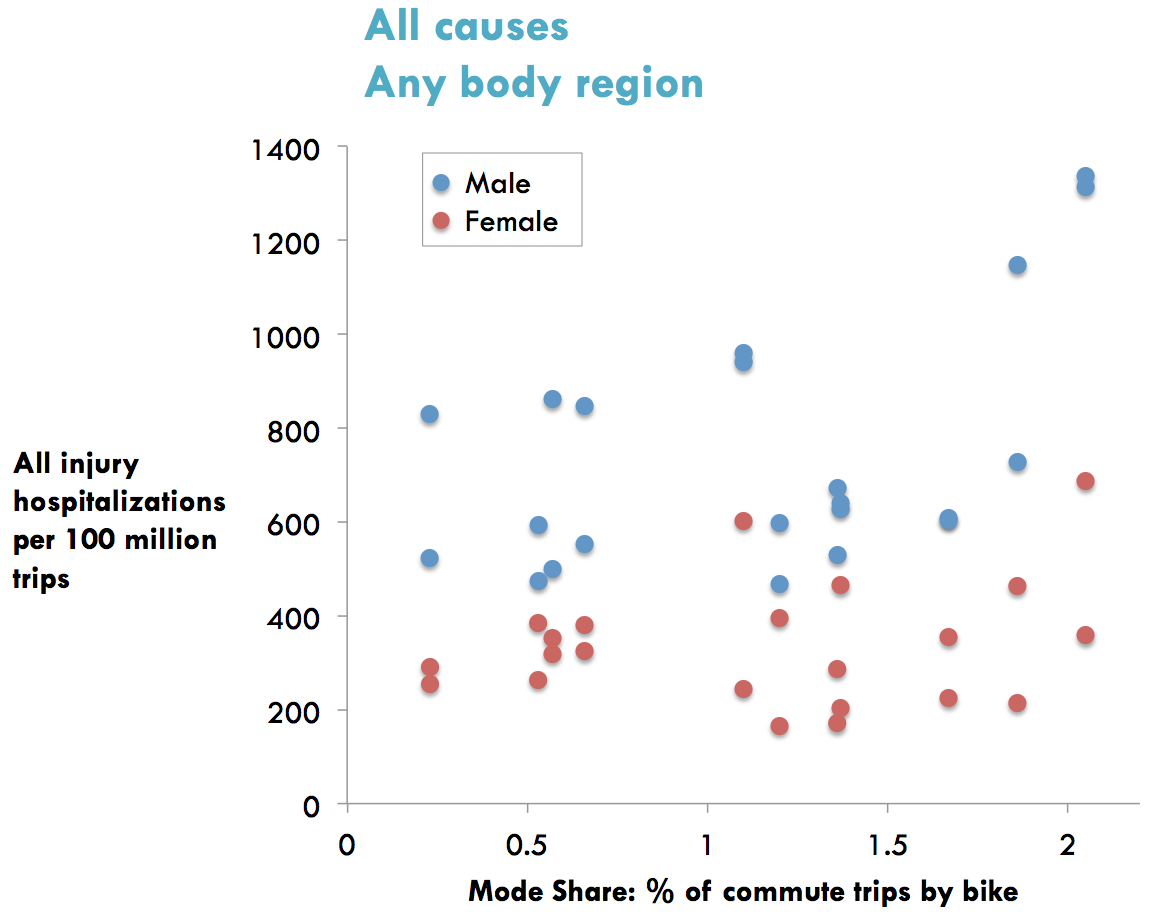
There was no pattern of hospitalization rates by age group (youths vs. adults).
Policy implications
These Canadian results indicate that cycling injury hospitalization rates were lower for females than males, and traffic-related injury rates were lower with higher cycling mode shares. Hospitalization rates for brain and head injuries were not different in provinces with and without helmet laws in the study years 2006 to 2011, a period of helmet law stability.
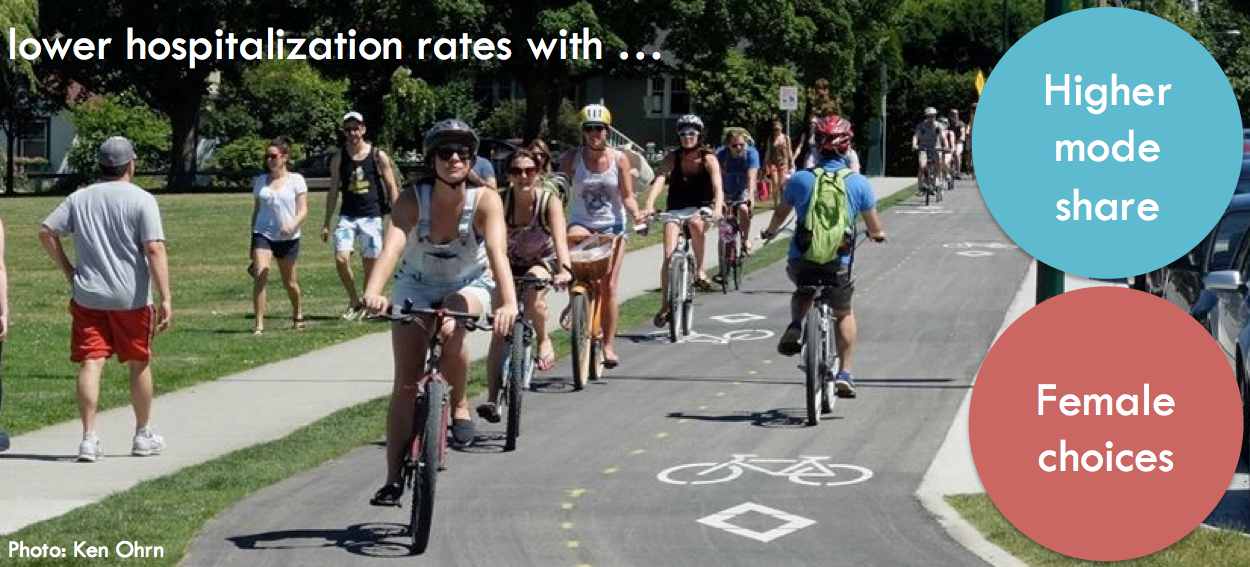
Thus policymakers interested in reducing cycling injury rates should focus on factors related to higher cycling mode shares and female cycling choices. Bike routes physically separated from traffic or along quiet streets are a promising fit for both and are associated with a lower risk of injury. This approach to safety is followed in Denmark and the Netherlands where cycling represents 20+% of trips, routes separated from traffic are common, helmet use is rare, and injury and fatality rates are low.
Publication
The results of this study are published here.