Overview
This study used data from the Canadian Community Health Survey and Environment Canada to test whether cycling rates in Canadian cities were affected by climate, demographics, or population.
The detailed study results are published in the following article:
Winters M, Friesen MC, Koehoorn M, Teschke K. Utilitarian bicycling: a multilevel analysis of climate and personal influences. American Journal of Preventive Medicine 2007;32(1):52-8. [link to abstract]
A figure and the abstract from the article are shown below.
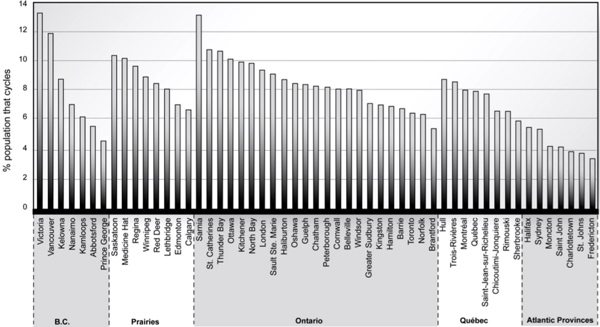
% who cycle
The figure below shows the proportion of people in each city* who reported bicycling in a typical week, data for Canadian cities with at least 50,000 people. Data source: Canadian Community Health Survey 2003. *Note that, in the Canadian Community Health Survey, cities are not identified directly via political boundaries, but via Health Regions.

Article abstract
Background: Increasing utilitarian bicycling in urban areas is a means to reduce air and noise pollution, increase physical activity, and reduce the risk of chronic diseases. We investigated the impact of individual- and city-level characteristics on bicycling in Canadian cities to inform transportation and public health policies.
Methods: The study population included 59,899 respondents to the 2003 Canadian Community Health Survey (CCHS) living in cities with populations greater than 50,000. In 2005, data on individual characteristics were drawn from the CCHS, and city-level climate data from Environment Canada records. Separate multilevel logistic regression models were developed for the general (nonstudent) and student populations.
Results: The proportion of the urban population reporting bicycling in a typical week was 7.9%, with students cycling more than nonstudents (17.2% vs 6.0%). In the general population, older age, female gender, lower education, and higher income were associated with lower likelihood of cycling. More days of precipitation per year and more days of freezing temperatures per year were both associated with lower levels of utilitarian cycling (odds ratios [ORs] for every 30-day increase in precipitation=0.84, 95% confidence interval [CI]=0.74-0.94, and for every 30-day increase in freezing temperatures OR=0.91, 95% CI=0.86-0.97). There was less variation in the proportion of students who cycled by age and income, and only the number of days with freezing temperatures influenced bicycling.
Conclusions: Bicycling patterns are associated with individual demographic characteristics and the climate where one lives. This evidence might be useful to guide policy initiatives for targeted health promotion and transportation infrastructure.


